
IoT Analytics & Reporting
One accurate view of usage, cost, health, and alerts across your entire connected estate.

Powering Real-Time Operational Intelligence for Global Enterprises
Why Carrier-Native Reporting Isn’t Enough at Scale
Every carrier reports usage, health, and billing data its own way, on its own schedule, in its own portal. That’s not a flaw in any single carrier’s tools, it’s what those tools were built to do: report on that carrier’s own network. The problem shows up once an enterprise runs devices across more than one carrier, which is most enterprises at any real scale.
At that point, “checking the numbers” stops being a single task. It becomes five or ten separate logins, five or ten different data formats, and a manual reconciliation exercise every time someone needs one accurate answer: how much is this device actually costing, is that alert real or a reporting artifact, which carrier’s network is actually driving the anomaly. None of that is a data problem. It’s a normalization problem, and no single carrier’s dashboard can solve it, because none of them can see past their own network.
What Simetric’s Analytics and Reporting Layer Actually Shows
Simetric doesn’t collect new data from your devices. It normalizes the data your carriers, platforms, and connectivity providers are already generating, approximately 80 million SIMs across more than 300 mobile network operator integrations and 1,200+ normalized APIs worth of it, into one consistent operational view.
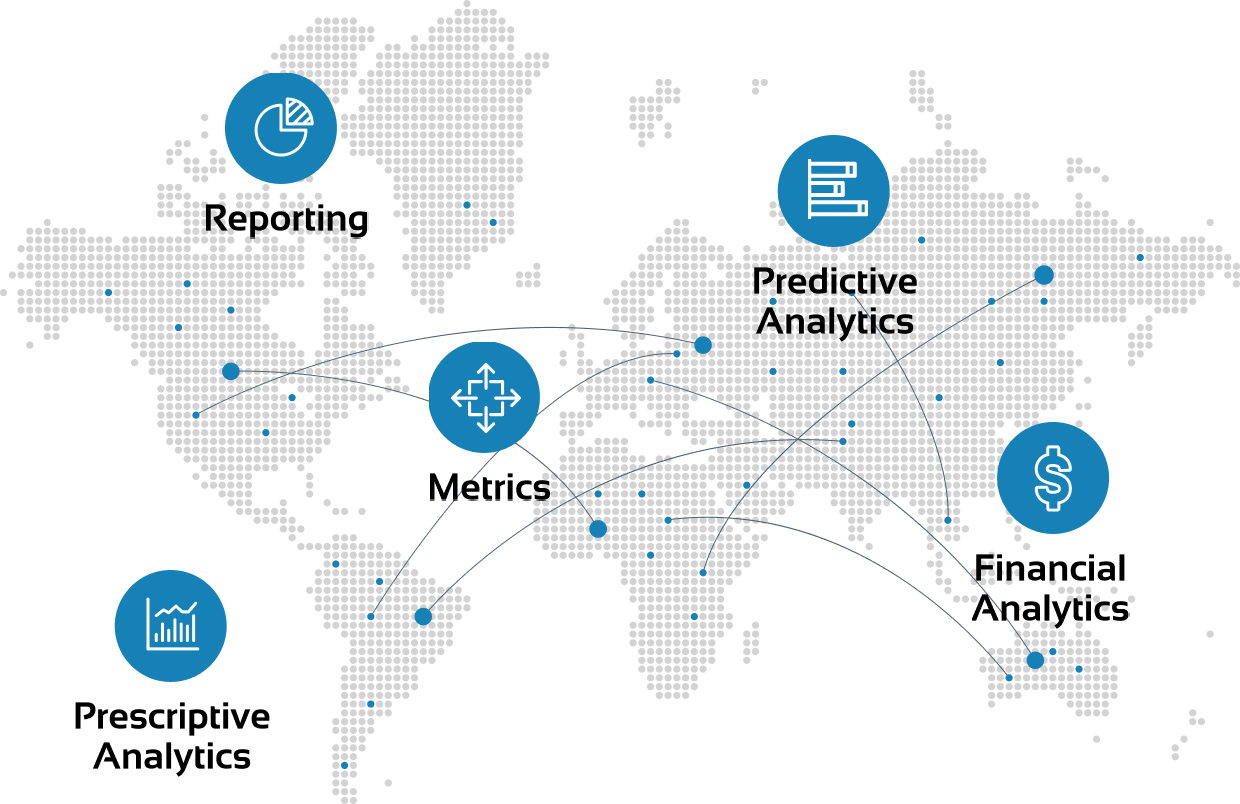
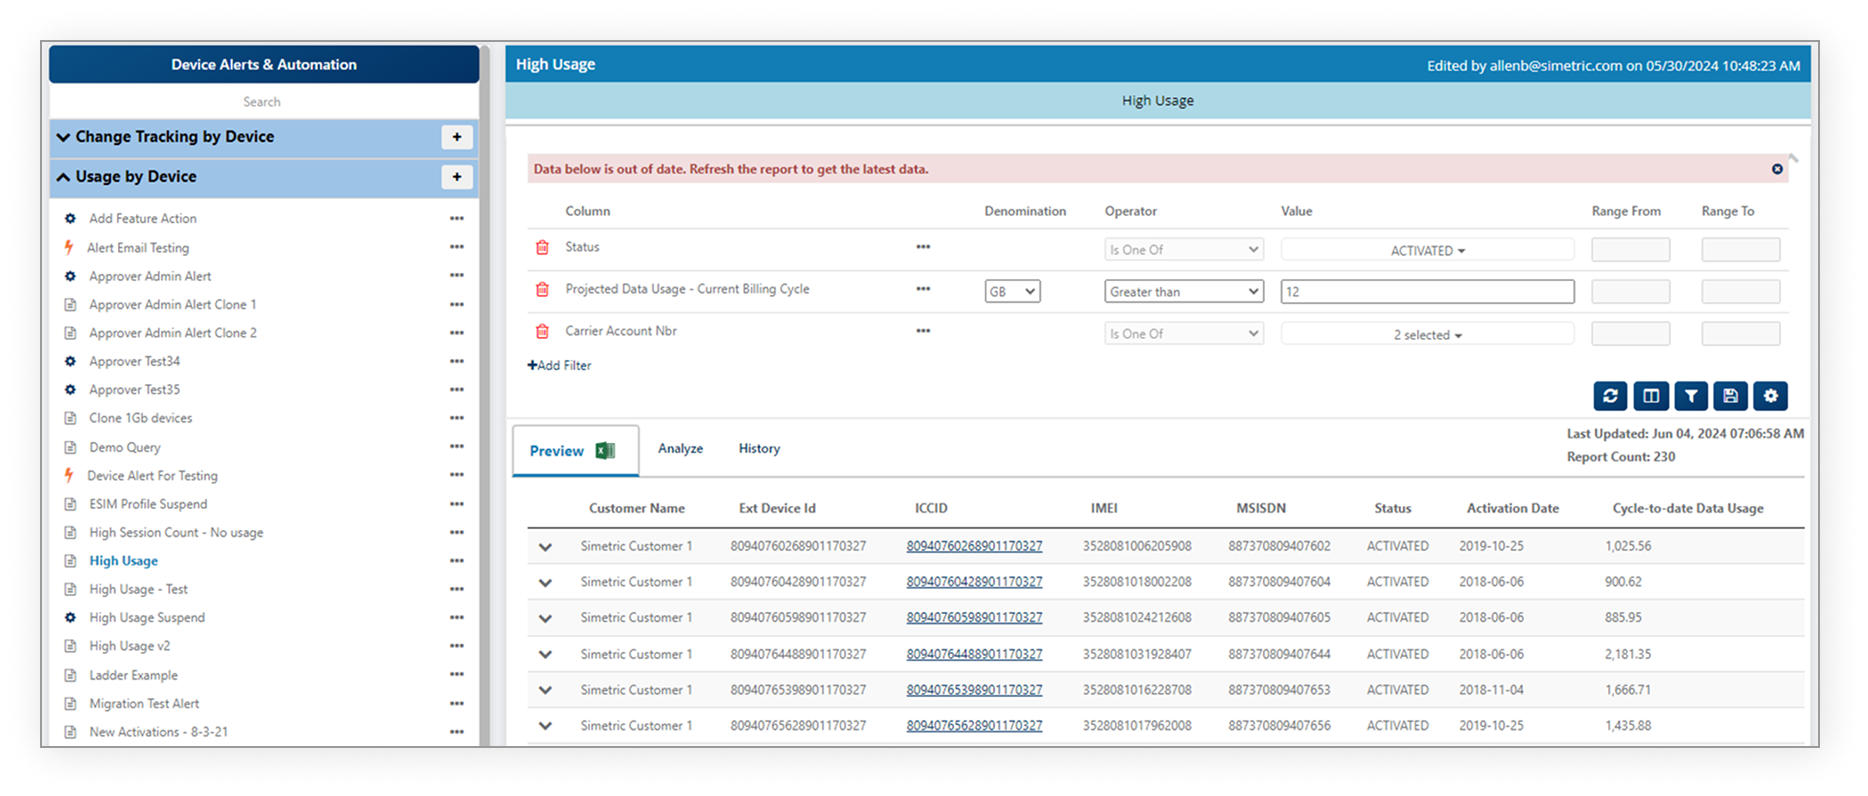
That view covers four things every operations team needs answered the same way, regardless of which carrier a device happens to be on: real-time usage, cost against expected spend, device and connection health, and policy-triggered alerts when something deviates from what’s normal for that device. Because the normalization happens at the enterprise orchestration layer rather than inside any one carrier’s system, a team can pull an answer across every carrier in the estate in a single session instead of reconciling five separate reports by hand.
What the Analytics Layer Covers
That view covers four things every operations team needs answered the same way, regardless of which carrier a device happens to be on.
The analytics layer covers:

Real-Time Usage
See exactly what every device is using, as it happens.


Device and Connection Health
Monitor the health of every device and its connection.

Policy-Triggered Alerts
Get flagged the moment something deviates from normal.
Related IoT & Edge Services
Data Lake
Turn distributed telemetry into operational intelligence.
Explore the Data LakeSingle Pane of Glass (SPoG) Management
One unified view across devices and carriers.
Explore SPoG ManagementConnectivity Management Platform
Unified control across every carrier relationship.
Explore Connectivity ManagementThis Isn’t Another Dashboard
The term Single Pane of Glass gets used loosely across this industry, often to describe exactly the kind of static reporting screen that caused the fragmentation problem in the first place. Simetric doesn’t build toward that definition.
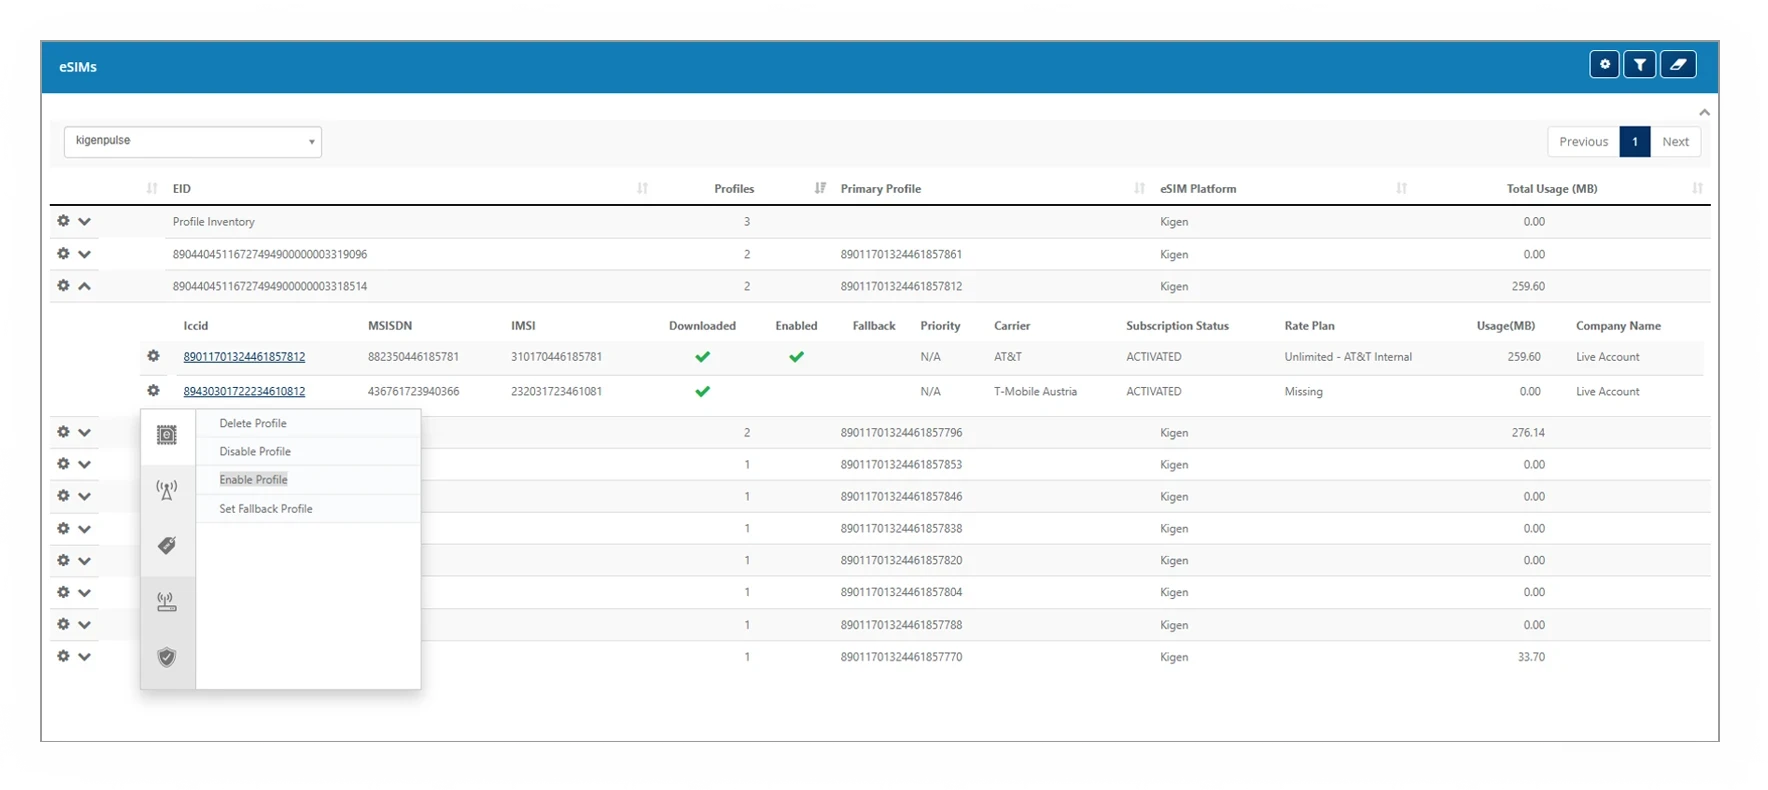
What enterprises actually need isn’t a screen that shows everything; it’s a layer that can act on what it shows. When Simetric’s analytics surface a cost anomaly or a device that’s gone quiet, that observation is tied to the same policy engine that governs the device’s lifecycle, so an alert isn’t just a number on a chart; it’s a trigger a team can act on immediately, in the same system, without switching tools. That’s the actual differentiator against a carrier-native dashboard: not a better-looking chart, a shorter distance between seeing a problem and doing something about it. Carrier portals report on their own network. Simetric is the platform that governs all of them.
Where This Matters Most
Cost and usage reporting matters everywhere Simetric operates, but it does the most work in a few specific situations: high-volume deployments where checking bills by hand is physically impossible (smart metering fleets running into the hundreds of thousands of endpoints), environments with real regulatory exposure where an auditable usage record isn’t optional, and any fleet where an unexplained cost spike or a silent device is the first sign something is actually wrong, not just a billing curiosity.
In each case, the value isn’t the report itself. It’s catching the anomaly before it becomes an incident, a surprise bill, or a compliance gap, rather than finding it during a scheduled review weeks later.
Client Success in Action
Simetric gave us total visibility over 40,000 remote endpoint SIMs in 3 weeks.
VP of IT, Fortunte 500 Energy Utility
35% Reduction in Unused SIM Costs
90% Faster Anomaly Detection
FAQs About IoT Analytics & Reporting
How is this different from the reporting my carrier already provides?
Carrier reporting only covers that carrier’s own network, in that carrier’s own format. Simetric normalizes reporting across every carrier in your estate into one consistent view, so a cost or health question has one answer instead of a different answer per carrier.
Does Simetric collect additional data from our devices?
No. Simetric normalizes and analyzes the telemetry your existing carriers and connectivity providers already generate. It doesn’t require new hardware or additional data collection to work.
What kinds of alerts does the platform generate?
Policy-triggered alerts on usage anomalies, unexpected cost spikes, and devices that stop reporting or behave outside their normal pattern. Because those alerts are tied to the same policy engine governing the device lifecycle, they connect directly to the workflow that acts on them, not just a notification with no next step.
Can this integrate with tools our team already uses, like ServiceNow or a BI platform?
Yes. Simetric exposes normalized data through standard integration paths, so it can feed existing IT service management tools, internal dashboards, or analytics platforms rather than becoming another isolated screen your team has to check separately.
Is this the same thing as a Single Pane of Glass dashboard?
Not in the way that term is usually used. A dashboard shows you data. Simetric ties that same data to the policy engine that governs your devices, so what you’re looking at is connected to what you can actually do about it.