You need it, we build it. We’re here to serve your IoT business and position you for success. That’s why many of our features are developed in response to our customers asking for solutions to their biggest business challenges. Our newest feature is no exception. We’re thrilled to unveil our Monthly Key Performance Indicator (KPI) report, designed to provide quick insight into deployment, cost drivers, churn, operational inefficiencies, and cost saving opportunities, all in one single pane of glass. Now your IT, Finance, Operations, Sales, and Marketing teams can align and rally behind a single set of KPIs and get ahead of issues and opportunities as they arise.
Managing IoT Seamlessly - Monthly KPI Report Features
This level of insight into your data exists nowhere else in the industry. When armed with the Simetric KPI report, your business will be best positioned to stay competitive amidst change and disruption
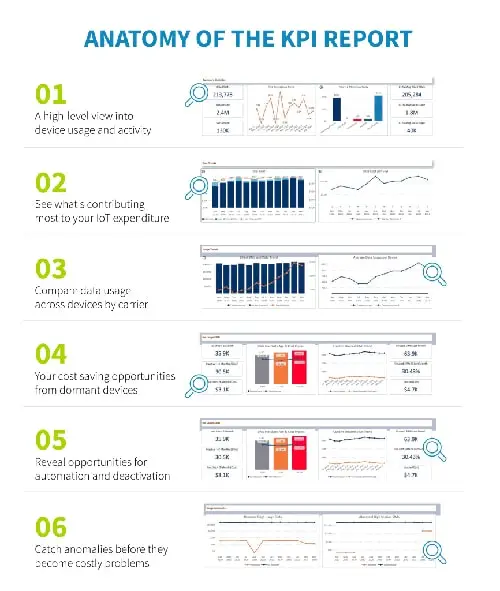
- Summary Statistics
These statistics provide insight into the deployment, subscriber growth, and churn for your IoT business. With this high-level overview, you can quickly assess if you need to dive deeper into usage and activity or if all is tracking as expected.
- IoT Cost Trends
Here you’ll find the total cost of your IoT expenditure, broken down by subscription, usage, voice, SMS, and more. See this expense trend over time to better understand which contributions are in flux and/or which are in need of trimming.
You will also have a view of data cost per SIM over time across all your carriers. This insight allows you to strategically determine future deployments and migrations.
- IoT Usage Trends
The Billed SIMs and Data Trend graph allows you to visually assess whether your data usage is in alignment with your deployment growth over time. Are they growing together? Or is your data usage increasing despite near-constant deployment?
You’ll also have a comparative view into device usage over time by carrier. This gives you at-a-glance insight into whether devices on one carrier are using significantly more data than others. From here, you can quickly assess opportunities for rate optimization.
- No Usage SIMs
These indicators illuminate the monthly cost saving opportunity associated with better device control. You will have industry-first insight into the number of IoT devices in your deployments that are not being used either at all, or of late. Oftentimes, these devices come from closed accounts that are no longer producing revenue. Deactivating the devices with Simetric lets you save on these unnecessarily incurred costs.
- Usage Anomalies
There’s nothing worse than being caught off guard by a rogue, stolen, or faulty device. Just one of these devices can be difficult to identify – and rarely in time to catch before they incur massive expenses. With Simetric, you have embedded levels of machine learning that provide full visibility into any usage anomaly present in your data, so you can get ahead of irregularities before they become major problems.
When IoT data insight leads to positive business outcomes
We hope you enjoy the latest feature in your Simetric dashboard. With a high-level overview of devices in your IoT ecosystem, you’ll be able to quickly, easily, and cost-efficiently manage your business. The KPI report will give you insights into which areas of your business may benefit from a granular look into the data and reveal opportunities to optimize cost management and data utilization across devices.
Sounds pretty good, right? We think so. Schedule a demo with us today to find out what’s in your data.